
So looking at a lot of raw data is pretty tough, but matlab handles it with ease.
So the above image shows a sample amiga track from a brand new disk, just recently formatted, within the amiga. It is basically as perfect of a sample as one could expect. A few things to notice about it:
- nice tight groupings
- Lots of space between ranges
- No real data points fall in the middle
- 3 separate ranges all within a reasonable definable tolerance
now let’s look at a bad track. Now this track was written on my amiga 15-20 years ago, and to tell you how bad this disk was getting —- it literally self-destructed a day or two after I sampled this data. I’m not sure if I posted about this, but at least one track was completely scraped off the disk —- it could have been lots of wear/tear with the read head constantly touching one particular track, but in any event, the disk was in bad shape.

Now the two images aren’t exactly the same size, so don’t inadvertently read into that. But now let’s notice what’s so wrong with this picture:
- much fatter groupings.
- a bunch of data in no-mans land. Compare especially the space between 4us and 5us.
- Almost the anti-thesis of the first picture!
You can see where reading the second disk poses some real problems, and I think that some PLL just isn’t going to deal well with this!
Now that this disk is gone, I really can’t work with it. I’ve got to find other samples that aren’t as bad that I can work with to further refine my hardware/software.
If anyone is interested, I took a capture using my Saleae Logic analyzer and then processed it with a small C program that spits out basically .csv. Then I imported the .csv into matlab, and turned off lines connecting the data points, and turned on a dot to represent a data point. And just for clarification, if you haven’t been following the blog, the y index represents time between low-going edges. The x index is basically the number of edges, so the zero-ith first delta t is on the left, and the rightmost dot would be the last delta t sampled.
I’m very happy to have the ability to visualize this stuff!
IT WORKS!!!
Hi I just have read 2 boxes of Amiga floppies recorded in 1992-6.
I am using the digital PLL we discussed 2 months before. The track is bit synchronized against the sync word and stored in 8K*16 FIFO in blockram.
It read all the flopies with none or few retries, with one exception – HD floppy with covered HD hole and formatted as DD. But it was not the error of data separator, but the floppy that lost most of it remanent magnetism, because of incorrect write current used to write.
I also detected the “something between” pulses, but I it has something to do with the write pre-compensation I think. Even my PC’s controller is doing that.
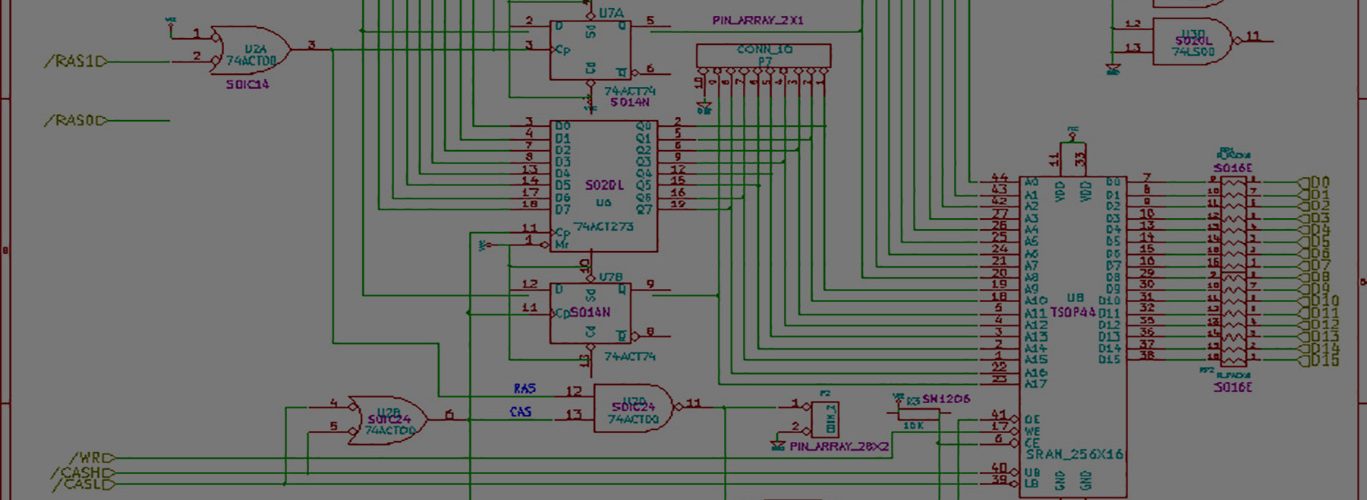
The following project is for Nexys2 board with 1200 cells. Onboard USB controller is used for control and data transfer. I have a little wire board between FPGA and the floppy cable, with 74HC14 on all used signals. So all signals are inverted.
The reading speed is little slower than A500.
The program is made in Delphi 6 personal, but it can be compiled in Lazarus too, after applying the Delphi -> Lazarus project conversion (included in Lazarus)
http://www.tomas-franke.cz/speccy/AmigaFloppy.zip
PS: Thank you for the decoding script
Congratulations!! Very exciting indeed.
Do you have photos etc of the project in action?
I’ll have to look through your VHDL when I get a chance.
Congrats again — good work.