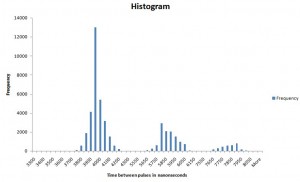
Here’s a histogram of one track off an amiga floppy disk. Notice the peaks near 4us, 6us, and 8us.
I’ve got this data from my logic analyzer, crunched through my little C proggie, and then graphed with Excel.
This shows roughly 45,000 delta Ts, the time between each transition. The first group, of course, the ’10’s, second ‘100’s and the third, ‘1000’s.


Add comment